Workload Scaling Rules
CCE supports multiple workload scaling modes. Comparisons between the scaling policies are listed in the following table.
Item | HPA | CronHPA | AHPA |
|---|---|---|---|
Introduction | Enhanced based on HPA, CronHPA is mainly used if the resource usage of applications changes periodically. | Advanced Horizontal Pod Autoscaler, which performs scaling beforehand based on historical data. | |
Rule | Scales Deployment pods based on metrics (CPU usage and memory usage). | Scales Deployment pods periodically (daily, weekly, monthly, or yearly at a specific time). | Predicts the resources needed based on the historical usage of container resources (CPU and memory) and automatically scales workload pods beforehand. |
Enhancement | Adds the application-level cooldown time window and scaling threshold functions based on the Kubernetes HPA. | Compatible with HPA objects, allowing you to use both CronHPA and HPA.
| Identifies periods of pod scaling and predicts future fluctuations by analyzing historical service metrics. This proactive approach can resolve the issue of delayed scaling in native HPA. |
Usage |
How HPA Works
HPA is a controller that controls horizontal pod scaling. HPA periodically checks the pod metrics, calculates the number of pods required to meet the target values configured for HPA resources, and then adjusts the value of the replicas field in the target resource object (such as a Deployment).
A prerequisite for auto scaling is that your container running data can be collected, such as number of cluster nodes/pods, and CPU and memory usage of containers. Kubernetes does not have built-in monitoring capabilities, but you can use extensions like Prometheus and Metrics Server to monitor and collect data.
Prometheus is an open-source monitoring and alarming framework that can collect multiple types of metrics. Prometheus has been a standard monitoring solution of Kubernetes.
Metrics Server is a cluster-wide aggregator of resource utilization data. Metrics Server collects metrics from the Summary API exposed by kubelet. These metrics are set for core Kubernetes resources, such as pods, nodes, containers, and Services. Metrics Server provides a set of standard APIs for external systems to collect these metrics.
HPA can work with Metrics Server for auto scaling based on the CPU and memory usage. It can also work with Prometheus for auto scaling based on custom monitoring metrics.
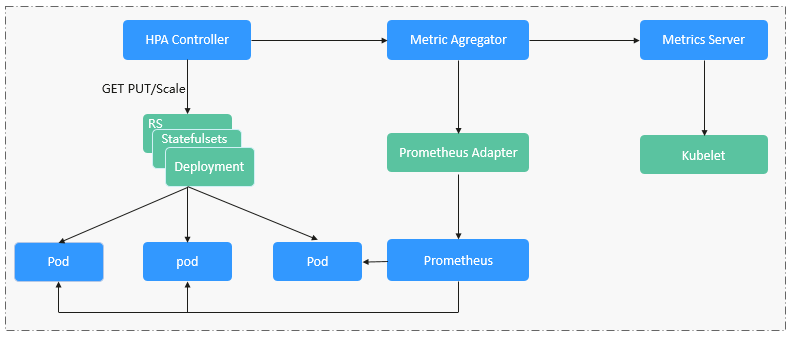
Figure 1 shows how HPA works.

Figure 1 HPA working process
Two core modules of HPA:
Data Source Monitoring
The community provided only CPU- and memory-based HPA at the early stage. With the population of Kubernetes and Prometheus, developers need more custom metrics or monitoring information at the access layer for their own applications, for example, the QPS of the load balancer and the number of online users of the website. In response, the community defines a set of standard metric APIs to provide services externally through these aggregated APIs.
metrics.k8s.io provides monitoring metrics related to the CPU and memory of pods and nodes.
custom.metrics.k8s.io provides custom monitoring metrics related to Kubernetes objects.
external.metrics.k8s.io provides metrics that come from external systems and are irrelevant to any Kubernetes resource metrics.
Scaling Decision-Making Algorithms
The HPA controller calculates the scaling ratio based on the current metric values and desired metric values using the following formula:
Desired number of pods = Rounded up value of [Number of current pods x (Current metric value/Target value)]
For example, if the current metric value is 200m and the target value is 100m, the desired number of pods will be doubled according to the formula. In practice, pods may be constantly added or reduced. To ensure stability, the HPA controller is optimized from the following aspects:
Cooldown interval: In v1.11 and earlier versions, Kubernetes introduced the startup parameters horizontal-pod-autoscaler-downscale-stabilization-window and horizontal-pod-autoScaler-upscale-stabilization-window to indicate the cooldown intervals after a scale-in and scale-out, respectively, in which no scaling operation will not be performed. In versions later than v1.14, the scheduling queue is introduced to store all decision-making suggestions detected within a period of time. Then, the system makes decisions based on all valid decision-making suggestions to minimize changes of the desired number of pods to ensure stability.
Tolerance: It can be considered as a buffer zone. If the pod number changes can be tolerated, the number of pods remains unchanged.
ratio = Current metric value/Target value
When |ratio - 1.0| <= tolerance, scaling will not be performed.
When |ratio - 1.0| > tolerance, the desired value is calculated using the formula mentioned above.
The default value is 0.1 in the current community version.
The HPA performs scaling based on metric thresholds. Common metrics include the CPU and memory usage. You can also set custom metrics, such as the QPS and number of connections, to trigger scaling. However, metric-based scaling brings in latency of minutes generated during data collection, determination, and scaling phases. Such latency may cause high CPU usage and slow response. To solve this problem, CCE allows you to configure scheduled policies to scale resources regularly for applications with periodic changes.