Basic Concepts
Application Topology
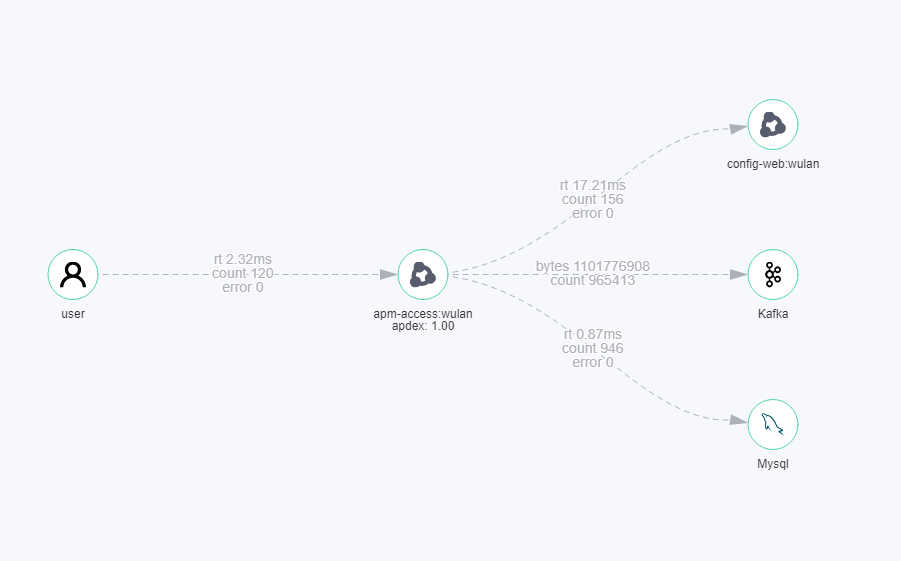
A topology graphically displays call and dependency relationships between applications. It is composed of circles, lines with arrows, and resources. Each line with an arrow represents a call relationship. The number of requests, average response time, and the number of errors are displayed above the line. Different colors indicate different RT ranges, helping you quickly detect and locate faults.
Note
Database: When the database call time is greater than or equal to 100 ms, the value turns yellow. When this time is greater than or equal to 200 ms, the value turns red.
Cache: When the cache call time is greater than or equal to 10 ms, the value turns yellow. When this time is greater than or equal to 30 ms, the value turns red.
Other API calls: When the API call time is greater than or equal to 500 ms, the value turns yellow. When this time is greater than or equal to 1000 ms, the value turns red.
If the number of errors is greater than 0, the value turns red.

Figure 1 Application topology
Tracing
By tracing and recording application calls, APM displays the execution traces and statuses of application requests in systems, so that you can quickly locate performance bottlenecks and faults.
APM Agent
APM Agents use bytecode enhancement technology to collect application performance data in real time. They run on the server where applications are deployed. For details about data collection and usage, see Data Collection. Before using APM, ensure that APM Agents have been installed.
URL Tracing
URL tracing is to trace the call relationship of an application. For example, the complete process of calling an e-commerce system's API to create orders is "user request > web server > database > web server > user request."
If a URL is added for tracing, APM will focus on tracing its downstream calls. Through URL tracing, you can monitor the call relationships between important APIs and downstream services, and detect problems more precisely.
Apdex
Apdex is an open standard developed by the Apdex alliance. It defines a standard method to measure application performance. The Apdex standard converts the application response time into user satisfaction with application performance in the range of 0 to 1.
Apdex principle
Apdex defines the threshold "T" for application response time. "T" is determined based on performance expectations. Based on the actual response time and "T", user experience can be categorized as follows:
Satisfied: indicates that the actual response time is shorter than or equal to "T". For example, if "T" is 1.5s and the actual response time is 1s, user experience is satisfied.
Tolerable: indicates that the actual response time is greater than "T", but shorter than or equal to "4T". For example, if "T" is 1s, the tolerable upper threshold for the response time is 4s.
Frustrated: indicates that the actual response time is greater than "4T".

Apdex calculation
In APM, the Apdex threshold is the maximum response time that makes users satisfied. The application response latency is the service latency. The Apdex value ranges from 0 to 1 and is calculated as follows:
Apdex = (Number of satisfied samples + Number of tolerable samples x 0.5)/Total number of samples
CMDB
Configuration Management Database (CMDB) structures and displays application resource configuration, so that you can better monitor and manage applications. It consists of:
Application (global concept): refers to a logical unit. You can view the same application information in all regions. For example, an independent functional module under an account can be regarded as an application.
Sub-application (global concept): similar to a folder. You can create up to three layers of sub-applications under an application.
Component (global concept): refers to a program or microservice. It is generally used together with environments. A component can contain one or more environments. For example, an order app can be deployed in the function test environment, pressure test environment, pre-release environment, or live network environment.
Environment: Components or programs with different configurations are deployed in different environments. Each environment has its own region attribute. You can filter environments by region. You can also add one or more tags to an environment and filter environments by tag.
Instance: refers to a process in an environment. It is named in the format of "host name+IP address+instance name." An environment is usually deployed on different hosts or containers. If an environment is deployed on one host, differentiation by instance is supported.
Environment tag: an attribute for filtering environments. Different environments may have the same tag. Tags carry public configuration capabilities. For example, the configuration set on a tag can be shared by the environments with the same tag. Tags defined for environments of one application cannot be applied to other applications.