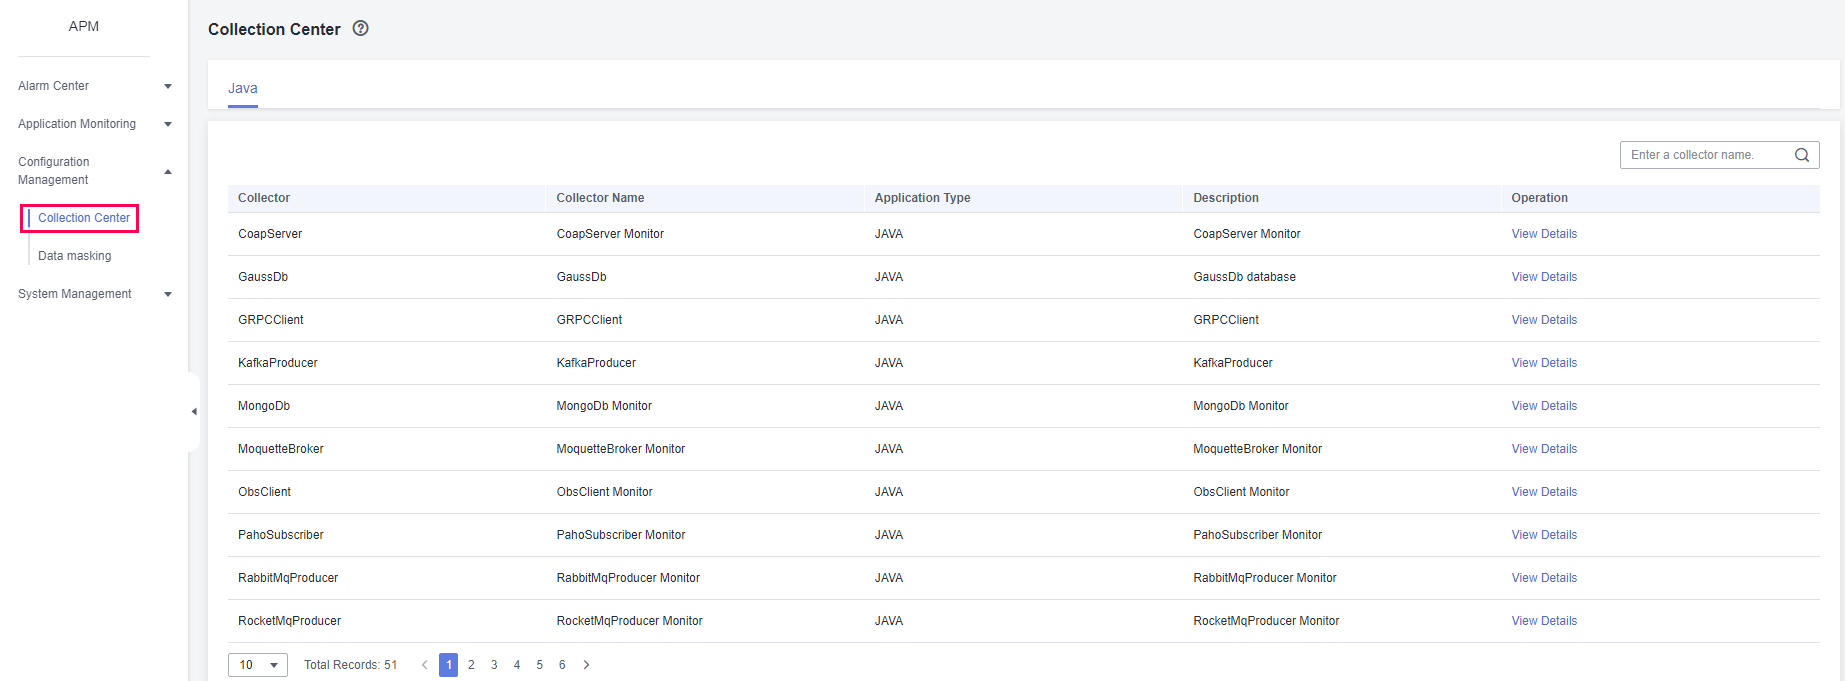
Collection Center
Collection Center displays collectors in a centralized manner. You can view and manage various collectors, metrics, and collection parameters supported by APM.
Viewing Collector Details
Log in to the management console.
Click
 on the left and choose Application > Application Performance Management.
In the navigation pane, choose Configuration Management > Collection Center.
All the supported collectors are displayed.
In the collector list, click View Details in the Operation column in the row that contains the target collector. The collector details page is displayed.

Figure 1 Viewing collector details
The collector details page consists of three modules: basic information, collection parameters, and metric set.
Basic information
This module displays collector information such as collector name and type.
Collection parameters
This module displays the custom parameter settings supported by the collector. The settings take effect after being delivered to JavaAgents and are used for custom collection.
Metric sets
This module displays information about the metrics collected by the collector.
Collector
A collector is a plug-in for collecting metric data. It consists of the collector description, metric set, and collection parameters. Collector description describes the data collected by a collector. Metric set is the data collected according to specifications. Collection parameters are the custom data to be collected.
Data is collected by APM Agents. For example, Java performance data is collected by JavaAgents. The data collected by APM Agents must correspond to the data models of collectors' metric sets so that servers can process the data.
The Agent of each language and framework defines its own collector.
After a collector is added to an environment, it is instantiated as a monitoring item. This process is generally automated. APM Agents automatically discover collection plug-ins used by applications and add collectors to the environment to form monitoring items. For example, if a Java application connects to a database through the JDBC driver for MySQL, the MySQL collector is automatically added to the environment to form a monitoring item.
Collection Parameters
Collectors corresponding to monitoring items define collection parameters. You can modify collection parameters on the page as required. These parameters will be delivered to Agents with heartbeat parameters to change collection behaviors. By default, Redis instruction content is not collected for security purposes. If necessary, modify collection parameters to collect specific instruction data. Collection parameters can also be defined on environment tags. Collectors automatically inherit collection parameter attributes of corresponding environment tags. In this way, configuration is automated. For details about how to set collection parameters, see Application Monitoring Configuration.
Metric Sets
A collector collects data of multiple metric sets. For example, the URL collector collects URL details, overall call condition, and status statistics. Each type of statistics corresponds to a metric set. Each metric set contains multiple metrics. For example, the metric set of URL details contains metrics such as the URL, method, number of calls, number of errors, and slowest call. Each metric corresponds to a data type.
APM supports the following types of metric data:
Data Type | Description | Remarks |
|---|---|---|
ENUM | Enumeration | Primary key type. In the example of URL monitoring, the URL and method metrics are primary keys, and other metrics such as the number of calls correspond to the URL and method. |
INT | Integer | Maximum size: 8 bytes |
DOUBLE | Floating-point number | 8-byte floating-point number |
STRING | Character string | Maximum length: 1,024 characters |
CLOB | Large character string | Maximum size: 1 MB |
DATETIME | Time | Time is automatically displayed on the page. |