Web Container
This function monitors web containers, including Tomcat. This section focuses on Tomcat monitoring.
Going to the Web Container Page
Log in to the management console.
Click
 on the left and choose Application > Application Performance Management.
In the navigation pane, choose Application Monitoring > Metrics.
In the tree on the left, click
 next to the target environment.
Click the Web Container tab. By default, the Tomcat monitoring information of all instances is displayed. For details about the metrics, see Table 1.
Table 1 Tomcat monitoring parameters¶ Metric Set
Metric
Description
Tomcat port monitoring
name
Port name.
Current Threads
Number of current threads on the port.
Busy Threads
Number of busy threads on the port at the time of collection.
Peak Busy Threads
Maximum number of busy threads on the port in a collection period.
Max Threads
Maximum number of threads on the port.
Max Connections
Maximum number of connections on the port.
Current Connections
Number of current connections of the port at the time of collection.
Peak Connections
Maximum number of connections on the port in a collection period.
Version
Version
Tomcat version.
Click a number in pink (such as those in the Current Threads, Busy Threads, or Peak Busy Threads column) to view the trend graph of the target web container in a specified period.
Click a version in the Version column to view details.
On the displayed Web Container tab page, select a target instance and monitoring item to view the monitoring data in different metric sets.
Select a time range. Default: Last 20 minutes.
Options: Last 20 minutes, Last hour, Last 3 hours, Last 6 hours, Last day, Today, Yesterday, Last week, Last month, or Custom.
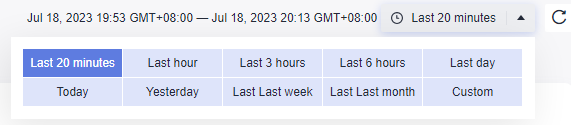
Figure 1 Selecting a time range
Click
 in the upper right corner of the list and select the metric data you want to view.