Monitoring Metrics
AOM displays metric data of each resource on the Metric Monitoring page. You can monitor metric values and trends in real time, add metrics to dashboards, create threshold rules, and export reports for real-time monitoring and correlation analysis.
Procedure
Log in to the management console.
Under Application, click Application Operations Management.
In the navigation pane, choose View Management > Metric Monitoring.
Select up to 10 metrics from the metric tree on the left to monitor. For details, see Metric Description.
Set metric parameters according to Table 1, view the metric graphs on the right, and analyze metric data from multiple dimensions.
Table 1 Metric parameters¶ Parameter
Description
Time Range
Time period when metrics are monitored.
Statistical Period
Interval at which metric data is collected.
Statistic
Method used to measure metrics.
Note
The number of samples equals to the count of data points.
If you change the statistical method, the new setting will take effect for all metrics.
Related Operations
You can also perform the operations described in Table 2.
Operation | Description |
|---|---|
Add a metric graph to a dashboard | Click Add to Dashboard to add a metric graph to a dashboard. |
Add a threshold rule for a metric | Click Add to Threshold Rule, set threshold rule parameters, and click Submit to add a threshold rule. |
Export a monitoring report | Click Export Report to export a metric graph as a CSV file to a local PC. |
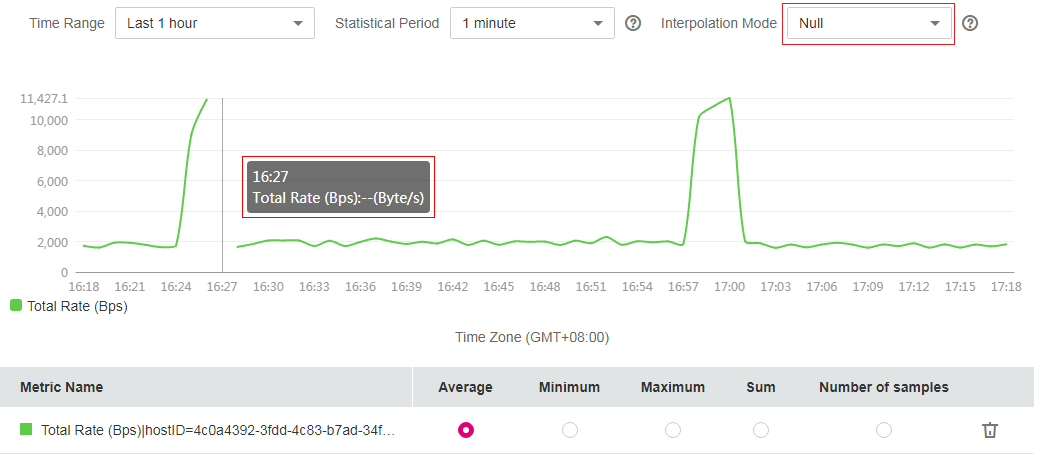
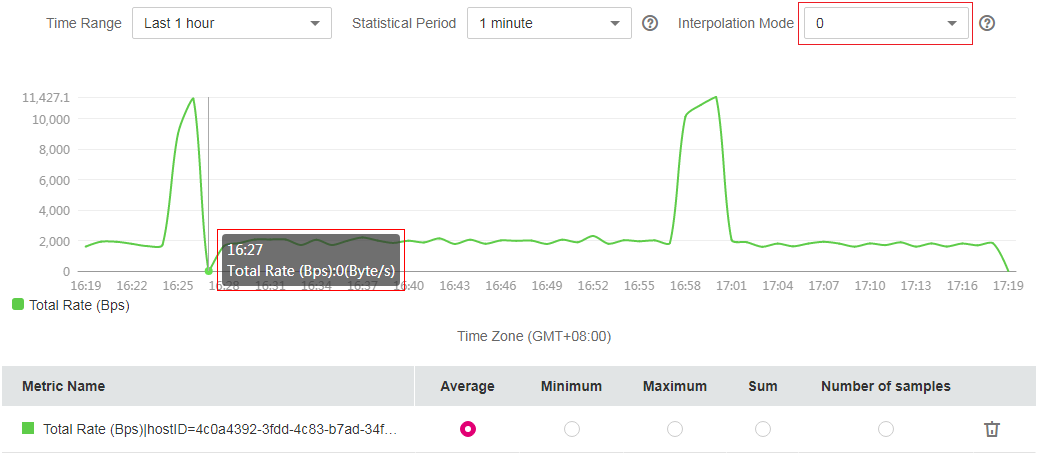
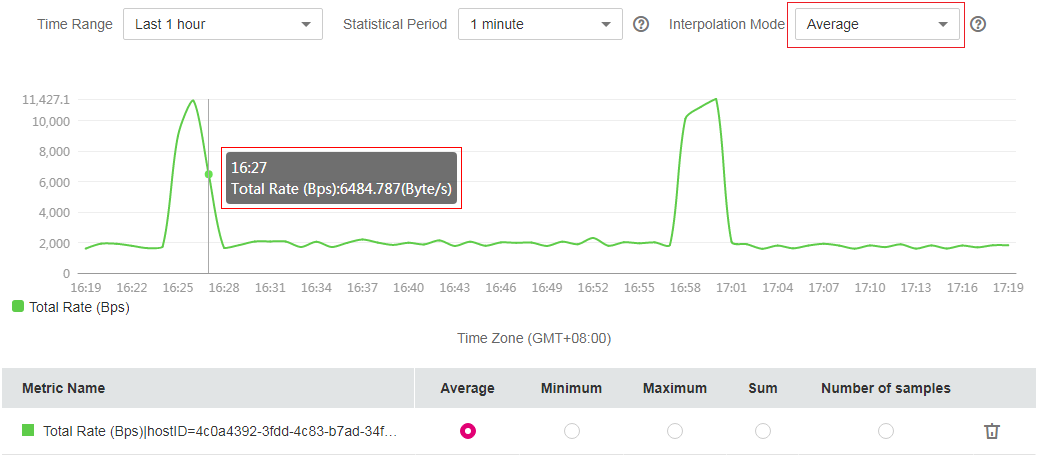
Set an interpolation mode | By default, AOM uses Null to represent breakpoints in a metric graph, as shown in Figure 1. However, a metric graph with breakpoints is not suitable for reports or presentation. To solve the problem, set the value of Interpolation Mode to 0 or Average to interpolate values. In this way, you can replace the missing metric data and avoid breakpoints. The value of Interpolation Mode can be Null, 0, or Average.
|