Monitoring Services
Services refer to containers and common processes you deploy. For example, a workload on Cloud Container Engine (CCE) is a service, and the Tomcat running on a VM is also a service.
The service list displays the type, CPU usage, memory usage, and alarm status of each service, helping you learn services. You can click a service name to learn more information. AOM supports drill-down from a service to a service instance, a container, and then to a process. In this way, you can implement multi-dimensional monitoring.
Procedure
In the navigation pane, choose Service Monitoring and perform the following operations as required:
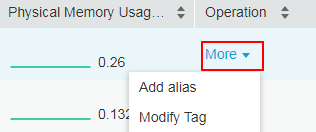
Adding an alias
If a service name is complex and difficult to identify, add an alias for the service.
Choose More > Add alias in the Operation column, and specify an alias.
Adding a tag
Tags are used to identify services. You can distinguish system and non-system services using tags. By default, AOM adds the System Service tag to system services, including icagent, css-defender, nvidia-driver-installer, nvidia-gpu-device-plugin, kube-dns, org.tanukisoftware.wrapper.WrapperSimpleApp, evs-driver, obs-driver, sfs-driver, icwatchdog, and sh. You can click
 in the upper right corner to select or deselect Hide system services. You can also customize tags to facilitate service management.
In the service list, choose More > Modify Tag in the Operation column of the service. On the displayed page, click
 to enter a tag, and click
  and OK. After the tag is added, enter a tag keyword in the search box in the upper right corner of the page to search for services.
Note
By default, the Tag column of the service list is hidden. You can click
 in the upper right corner and select or deselect Tag to show or hide them. In the Tags column, use double quotation marks ("") to separate tags. Enter the content in double quotation marks when using tags to search for services.
Rule Name
Sys_Rule: AOM automatically discovers services based on the built-in Sys_Rule.
Default_Rule: AOM automatically discovers services based on the built-in Default_Rule.
Click
 to switch to the card view or click
  to switch to the list.
Set filter criteria to search for the desired service.
You can select a cluster from the drop-down list above the service list to filter services, or directly enter a service name in the search box to search for a service.
Click the service name. The service details page is displayed.
On the Resource List tab page, view the service details.
On the Instance List tab page, view the instance details.
On the Host List tab page, view the host details.
On the Alarm Analysis tab page, view the alarm details.
Note
Click an instance name to monitor related resource usage and health status.
Click a host name to view details about the host where the service is deployed.
Click the View Monitor Graphs tab to monitor the various metrics of the service.