Overview
The Overview page provides full-link, multi-layer, and one-stop O&M for applications and resources. The following types of graphs are supported: infrastructure monitoring, host monitoring (CPU and memory), service monitoring (CPU and memory), instance monitoring (CPU and memory), host monitoring (disk), host monitoring (network), cluster monitoring (CPU and memory), and cluster monitoring (disk).
Log in to the management console.
Under Application, click Application Operations Management.
In the navigation pane, choose Overview to view information.
Infrastructure Monitoring
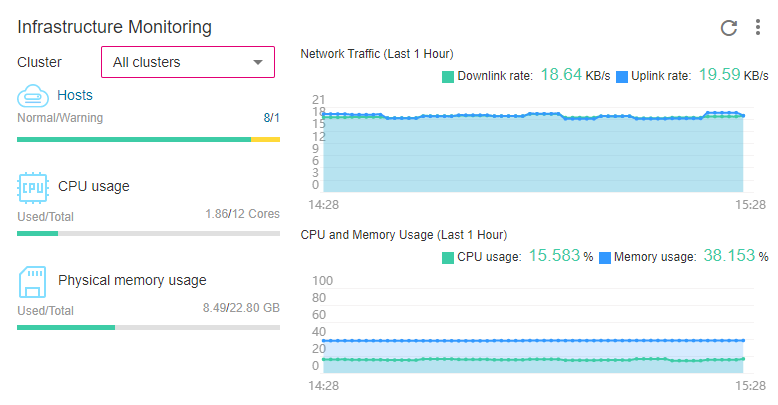
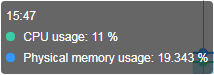
Figure 1 Infrastructure monitoring
This area displays infrastructure metrics. You can select one or all clusters to view monitoring information. In the preceding figure, all clusters are selected. The information includes:
Host running status, CPU usage, and physical memory usage.
Trend graph of network traffic in the last hour. The values of each point in the graph respectively indicate the total downlink/uplink rates of all clusters in one minute. The values displayed above the trend graph respectively indicate the total downlink/uplink rates of all clusters at the latest time point.
Trend graph of CPU usage and memory usage in the last hour. The values of each point in the graph respectively indicate the average CPU and memory usage of all clusters in one minute. The values displayed above the trend graph respectively indicate the average CPU and memory usage of all clusters at the latest time point.
Host Monitoring (CPU and Memory)
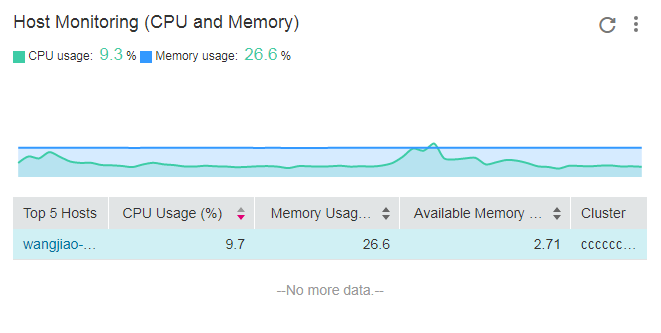
Figure 2 Host monitoring (CPU and memory)
The information includes:
The top 5 hosts with high CPU and memory usage in the last minute.
Trend graph of the CPU and memory usage of the selected host in the last hour. The values of each point in the graph respectively indicate the CPU and memory usage of the host in one minute.
CPU and memory usage of the selected host at the latest time point, which is displayed above the trend graph.
Note
When the value of a metric exceeds a threshold, a red line is displayed in the trend graph, alerting you that such a value needs attention.
Service Monitoring (CPU and Memory)
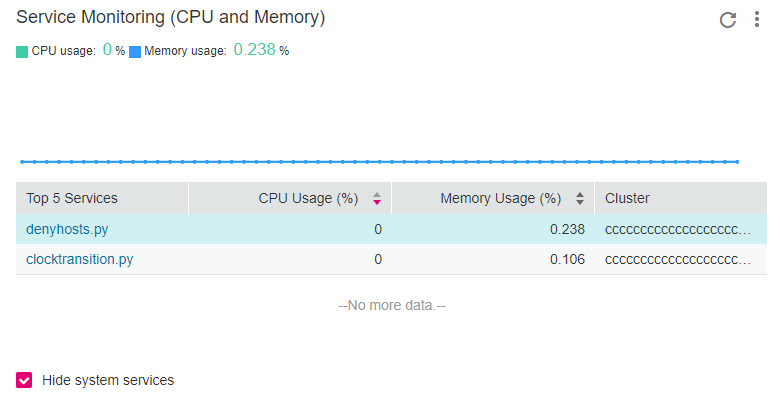
Figure 3 Service monitoring (CPU and memory)
The information includes:
The top 5 services with high CPU and memory usage in the last minute.
Trend graph of the CPU and memory usage of the selected service in the last hour. The values of each point in the graph respectively indicate the CPU and memory usage of the service in one minute.
CPU and memory usage of the selected service at the latest time point, which is displayed above the trend graph.
Option
 , which can be selected to hide system services.
Instance Monitoring (CPU and Memory)
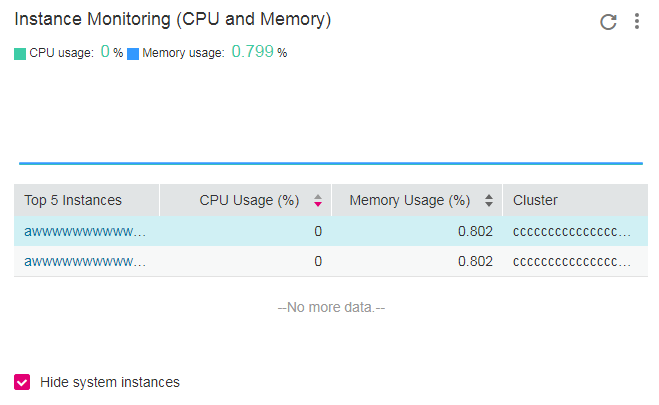
Figure 4 Instance monitoring (CPU and memory)
The information includes:
The top 5 instances with high CPU and memory usage in the last minute.
Trend graph of the CPU and memory usage of the selected instance in the last hour. The values of each point in the graph respectively indicate the CPU and memory usage of the instance in one minute.
CPU and memory usage of the selected instance at the latest time point, which is displayed above the trend graph.
Option
 , which can be selected to hide system instances.
Host Monitoring (Disk)
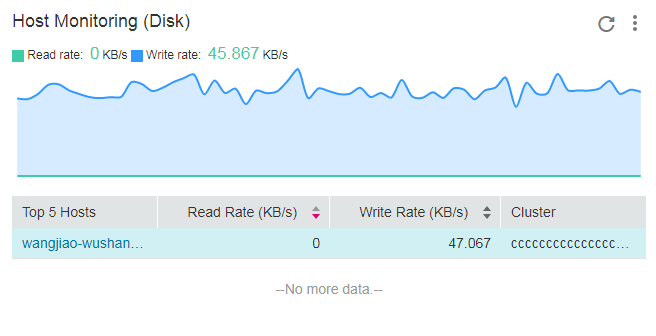
Figure 5 Host monitoring (disk)
The information includes:
The top 5 hosts with high disk read/write rate in the last minute.
Trend graph of the disk read/write rate of the selected host in the last hour. The values of each point in the graph respectively indicate the disk read/write rate of the selected host in one minute.
Disk read/write rate of the selected host at the latest time point, which is displayed above the trend graph.
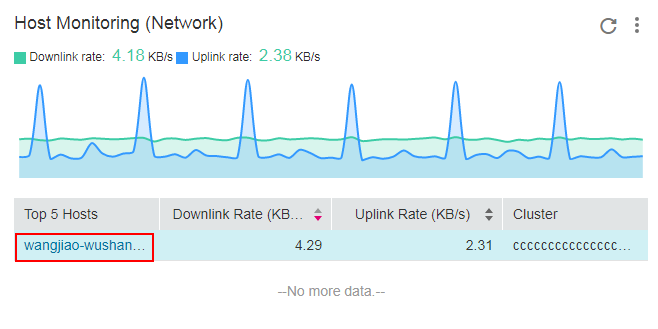
Host Monitoring (Network)
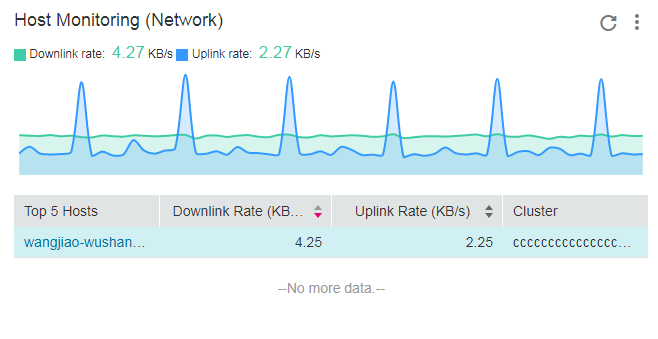
Figure 6 Host monitoring (network)
The information includes:
The top 5 hosts with high uplink/downlink network rate in the last minute.
Trend graph of the uplink/downlink network rate of the selected host in the last hour. The values of each point in the graph respectively indicate the uplink/downlink network rate of the selected host in one minute.
Uplink/downlink network rate of the selected host at the latest time point, which is displayed above the trend graph.
Cluster Monitoring (CPU and Memory)
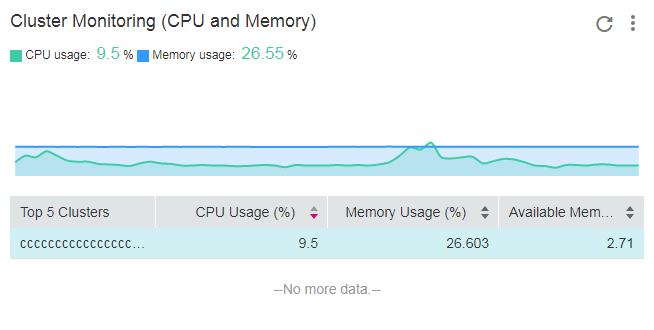
Figure 7 Cluster monitoring (CPU and memory)
The information includes:
The top 5 clusters with high CPU and memory usage in the last minute.
Trend graph of the CPU and memory usage of the selected cluster in the last hour. The values of each point in the graph respectively indicate the CPU and memory usage of the cluster in one minute.
CPU and memory usage of the selected cluster at the latest time point, which is displayed above the trend graph.
Note
When the value of a metric exceeds a threshold, a red line is displayed in the trend graph, alerting you that such a value needs attention.
When the values of multiple metrics exceed thresholds, multiple red lines are displayed in the trend graph. You can hover over the trend graph to view the values of different metrics, as shown in the following figure.
Cluster Monitoring (Disk)
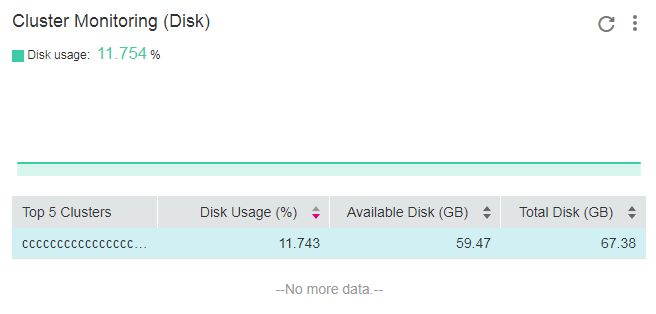
Figure 8 Cluster monitoring (disk)
The information includes:
The top 5 clusters with high disk usage in the last minute.
Trend graph of the disk usage of the selected cluster in the last hour. The value of each point in the graph indicates the disk usage of the cluster in one minute.
Disk usage of the selected cluster at the latest time point, which is displayed above the trend graph.
Related Operations
You can also perform the operations described in Table 1.
Operation | Description |
|---|---|
Favorites | Click Add to Favorites in the upper right corner of each monitoring area to move a graph to the Favorites. Click |
Enlarging a metric graph | Click |
Drilling down blue texts | Click blue texts, for example, a host name, to drill down to the details page, as shown in the following figure.
|
 on the right of the page to move a graph from the Favorites to the monitoring area.
 in the upper right corner of a metric graph to zoom it in.