Viewing Log Files
You can quickly view log files of component instances or hosts to locate faults.
Precautions
The time information contained in a log file, if any, is automatically displayed, as shown in the red box in Figure 1. This time information is irrelevant to the time range that you set.
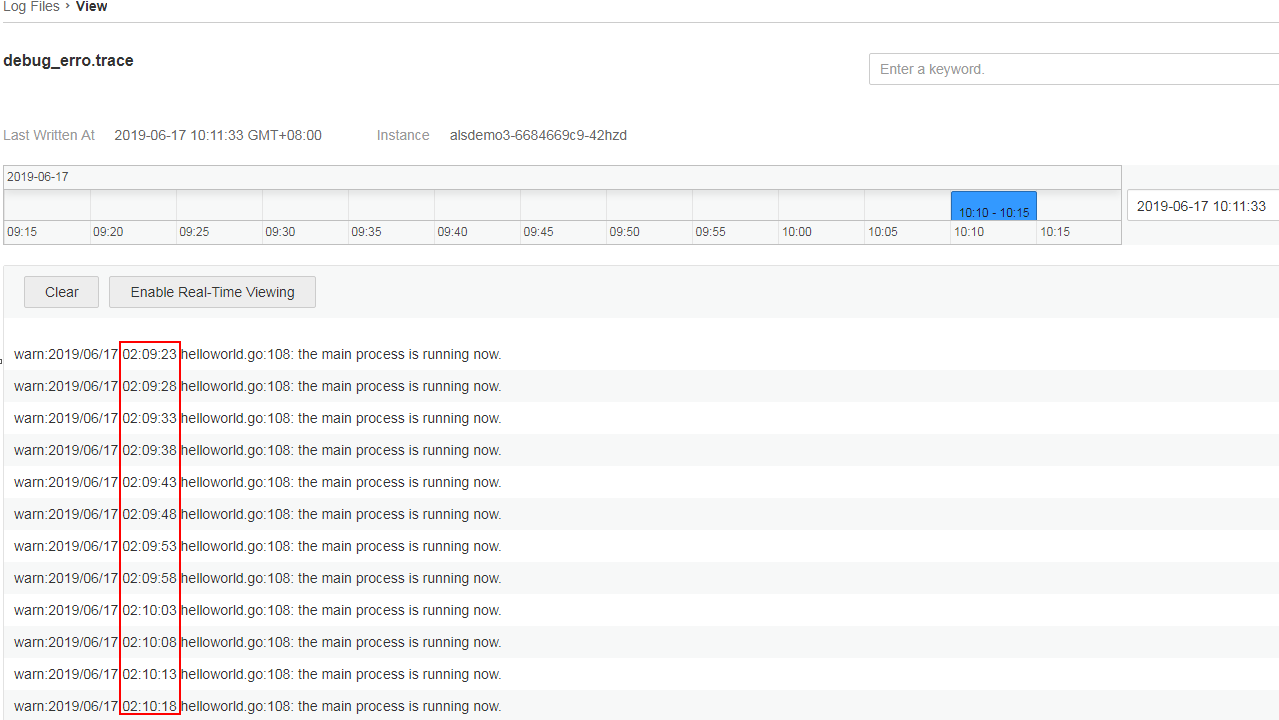
Figure 1 Viewing log files
Viewing Log Files
In the navigation pane, choose Log > Log Files.
On the page that is displayed, click the Component or Host tab and click a name. Information such as the log file name and latest written time is displayed on the right of the page.
Click View in the Operation column of the desired instance. Table 1 shows how to view log file details.
Table 1 Operations¶ Operation
Setup
Description
Setting a time range
Date
Click
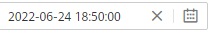 to select the date and time.
Time range
Select a specific time range on the time axis to view logs. You can select only one range (5 minutes) each time.
Viewing log files
Clear
Click Clear to clear the logs displayed on the screen. This operation clears only the logs displayed on the screen but does not delete them.
Viewing real-time logs
The function of real-time monitoring is disabled by default. To enable it, click Enable Real-Time Viewing. After this function is enabled, the latest written logs can be viewed.
The exception in the log records the exceptions that occur during code running. When using logs to locate faults, pay attention to the exception. For real-time log viewing, AOM automatically highlights exception keywords in logs, facilitating fault locating. Such keywords are case-sensitive. For example, exception and Exception are highlighted, but keywords such as EXCEPTION, exCeption, and EXception are not highlighted.
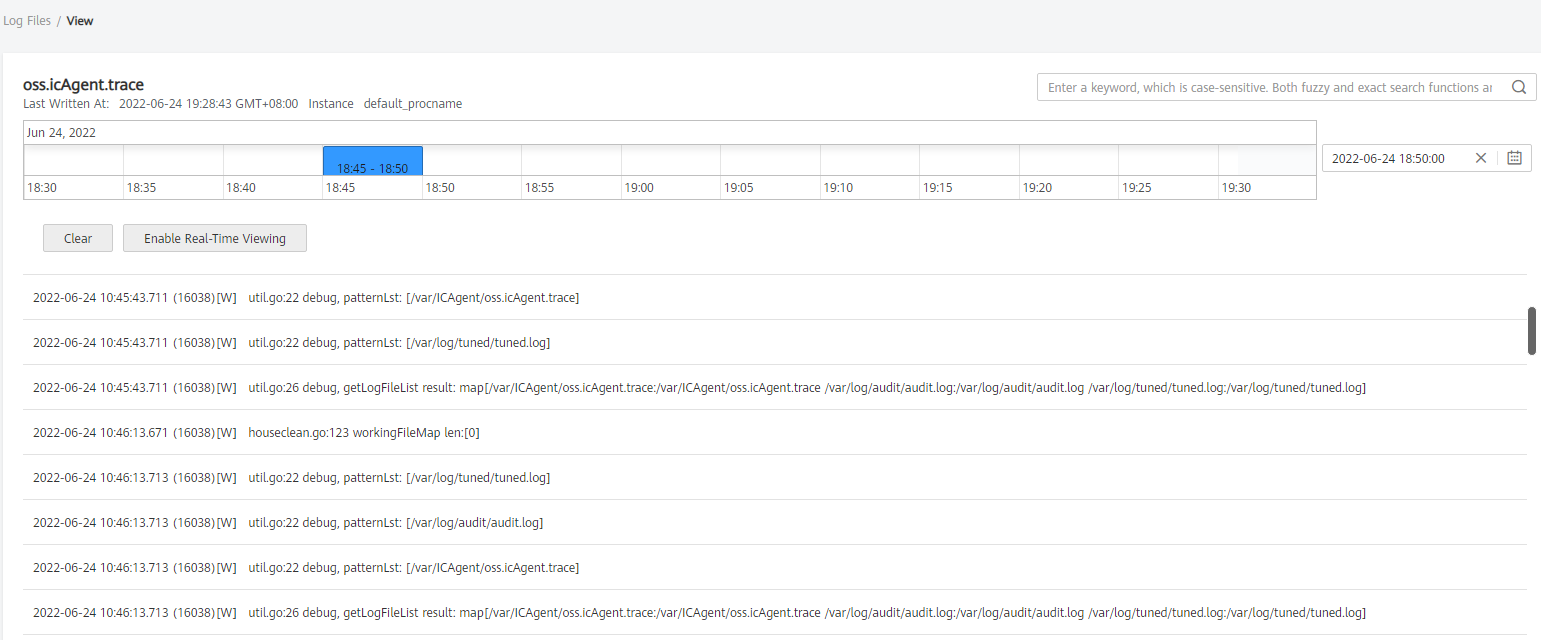
Figure 2 Log file details