Viewing Bucket Logs
AOM supports fine-grained log query. It enables you to view logs by bucket to obtain key service data and quickly locate problems.
Precautions
Ensure that you have added at least one log bucket according to Adding a Log Bucket before viewing bucket logs. Otherwise, bucket logs cannot be viewed.
You can only view bucket logs generated in the last seven days.
Viewing Bucket Logs
Log in to the management console.
Under Application, click Application Operations Management.
In the navigation pane, choose Log Management > Log Buckets. Then, click the Bucket Log tab and view bucket logs.
Set filter criteria.
Selecting a log bucket: Select a target log bucket from the drop-down list in the upper left corner.
Setting a time range: In the drop-down list in the upper right corner, select a relative time range, such as Last 30 minutes, Last 1 hour, or Last 6 hours, or set an absolute time range by specifying the start time and end time.
View the search result.
Viewing statistics in a bar chart
The bar chart shows the number of logs that meet the filter criteria set in step 4 at different time points. The horizontal axis represents the time and is divided into 30 identical rectangular blocks. The time of each rectangle block is calculated by dividing the selected time range by 30. For example, if the time range is 30 minutes, the time of each rectangle block is 1 minute. If the time range is 60 minutes, the time of each rectangle block is 2 minutes. The vertical axis represents the number of logs that meet filter criteria.
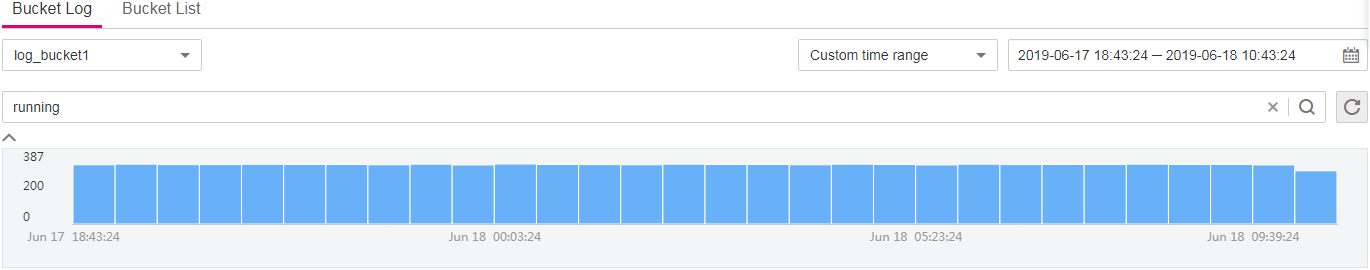
Figure 1 Viewing statistics in a bar chart
When you hover the mouse pointer over a rectangle block, the time range (including the start time and end time) and the number of logs that meet filter criteria are displayed. When you click a rectangle block, the logs of the rectangle block are displayed in the log list. To deselect the block, click
 next to the search box.
Viewing logs in a log list
The log list displays the details of the logs that meet the filter criteria set in 4.
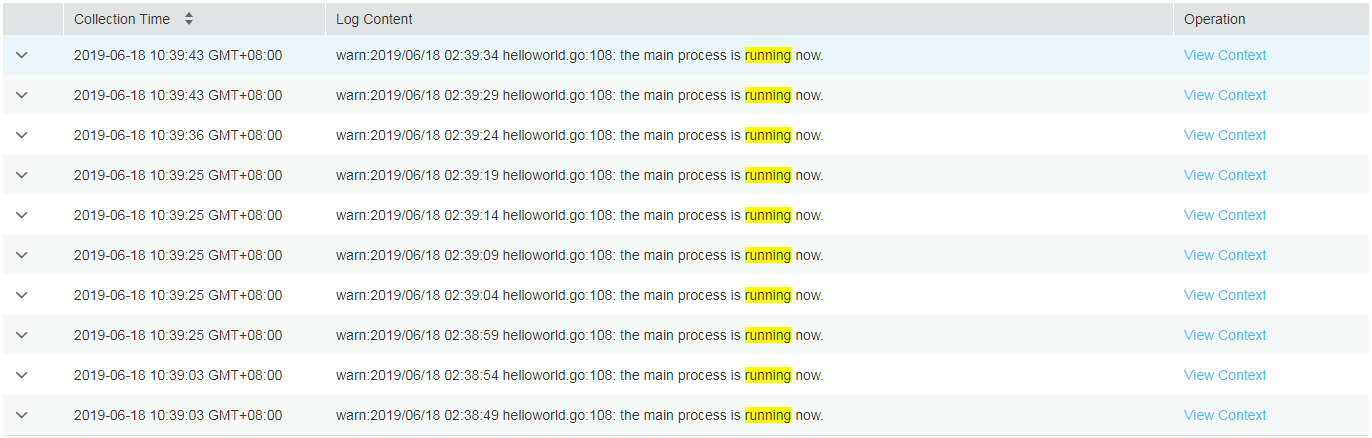
Figure 2 Viewing logs in a log list
You can also perform the following operations:
Click
 to view the details such as the host IP address and source of a specified log.
Sort search results: Logs are sorted based on the collection time in descending order by default. You can click
 in the Collection Time column to change the order. When you click the black triangle icon
  to sort logs by time in ascending order, the latest log is displayed at the end. When you click the black triangle icon
  to sort logs by time in descending order, the latest log is displayed at the top.
View the context of a specified log: AOM allows you to view the previous or next logs of a specified log by clicking View Context in the Operation column, facilitating fault locating. Therefore, you do not need to search for logs in raw files.
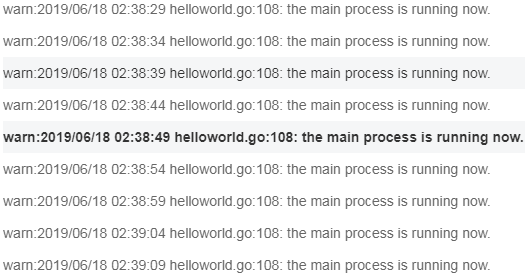
Figure 3 Viewing the log context