Creating a Threshold Rule
You can set threshold conditions for resource metrics by setting threshold rules. If a metric value meets a threshold condition, a threshold alarm will be reported. If there is no metric data, an insufficient data event will be reported.
Creation Methods
There are two creation methods: Directly Creating Threshold Rules and Using Templates to Create Threshold Rules. Only one rule is generated at a time. All resources are monitored using the same rule. To use the second method to create threshold rules, ensure that a static threshold template has been created according to Creating a Static Threshold Template.
Precautions
If you use a threshold rule to monitor the same metric of multiple resources in batches, pay attention to the following:
If the metric status of a resource is Exceeded, the status of the threshold rule is also Exceeded.
If the metric status of one or more resources is Insufficient or Normal, the status of the threshold rule is Normal.
Directly Creating Threshold Rules
Log in to the AOM console. In the navigation pane, choose Alarm Center > Alarm Rules. Then, click Create Alarm Rule in the upper right corner.
Set a threshold rule.
Set basic information such as the rule name and description.
Set details about the rule.
Set Rule Type to Threshold alarm.
Select monitored objects. Use either of the following methods:
Select resource objects: Click Select Resource Object, add objects by dimension or resource, and click Confirm.
Note
A threshold rule can monitor up to 100 pieces of metric data.
If you enable Apply to All (
 ) when selecting objects to monitor, an alarm rule will be created for all metrics of the type you select under an application or service. For example, if you select CCE/Host/Host/CPU Usage and enable Apply to All, an alarm rule will be created for all hosts in CCE.
Click Edit resource objects to modify the selected resource object.
Command input: Both manual and auto inputs are supported.
Manual input: used when you know the metric name and IP address, and you are familiar with the Prometheus format.
For example, to query the CPU usage of the host, run command avg(label_replace(avg_over_time(aom_node_cpu_usage{hostID="81010a40-1682-41c1-9645-f0588ff9c0cf",nodeIP="192.168.1.210",clusterId = '00000000-0000-0000-0000-00000000'}[59999ms]), "__name__","aom_node_cpu_usage","","")) by(__name__,hostID,nodeIP).
Note
For details about Prometheus commands, move the cursor to
 next to the search box and click Learn more.
Auto input: used when you do not know the metric information or are unfamiliar with the Prometheus format. The command can only be automatically filled when you switch from the Metric Monitoring page.
Specifically, choose Monitoring > Metric Monitoring in the navigation pane. Then, click Add Metric and select Dimension or Resource for Add By. Select up to 12 metrics to monitor. Next, click
 in the Operation column. The system automatically switches to the threshold rule creation page and fills the Prometheus command for your metric.
Set an alarm condition. Click Custom and set information such as Statistical Period, Consecutive Periods, and Threshold Criterion. Table 1 describes the parameters.
Table 1 Alarm condition parameters¶ Category
Parameter
Description
Trigger Condition
Statistical Period
Interval at which metric data is collected. By default, only one period is measured. A maximum of five periods can be measured.
Consecutive Periods
When the metric value meets the threshold condition for a specified number of consecutive periods, a threshold-crossing alarm will be generated.
Statistic
Method used to measure metrics. Options: Avg., Min., Max., Sum, and Samples.
Threshold Condition
Trigger condition of a threshold alarm. A threshold condition consists of two parts: operators (>=, <=, >, and <) and threshold value. For example, after Threshold Criterion is set to > 85, if the actual metric value exceeds 85, a threshold alarm is generated.
Move the cursor to the graph area above the alarm condition. The ID, IP address, and unit of the current metric are displayed.
Alarm Severity
Severity of a threshold alarm. Options: Critical, Major, Minor, and Warning.
Advanced Settings
Alarm Clearance
An alarm will be cleared if the monitored object does not meet the trigger condition within the monitoring period. By default, metrics in only one period are monitored. You can set up to five monitoring periods.
Action Taken for Insufficient Data
Action to be taken when no metric data is generated or metric data is insufficient within the monitoring period. You can set this option based on your requirements.
By default, metrics in only one period are monitored. You can set up to five monitoring periods.
Options: Alarm, Insufficient data, Keep previous status, and Normal.
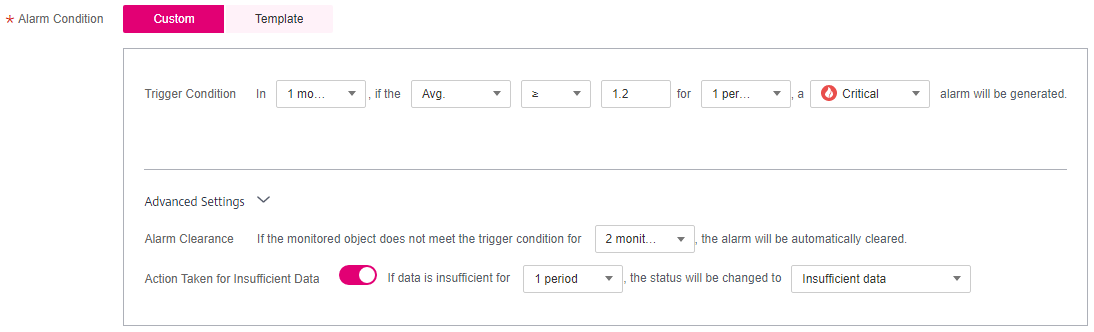
Figure 1 Setting an alarm condition
Set alarm tags and annotations to group alarms. They can be associated with alarm noise reduction policies for sending alarm notifications. For details, see Alarm Tags and Annotations.
Click Add Tag or Add Annotation.
Set an alarm notification policy. There are two alarm notification modes.
Direct Alarm Reporting: An alarm is directly sent when the alarm condition is met.
Specify whether to enable an alarm action rule. After an alarm action rule is enabled, the system sends notifications based on the associated SMN topic and message template. If the existing alarm action rules cannot meet your requirements, click Create Rule to create one. For details, see Creating an Alarm Action Rule.
After an alarm action rule is selected, specify whether to enable alarm clearance notification. After alarm clearance notification is enabled, if the alarm clearance condition set in Advanced Settings > Alarm Clearance is met, alarm clearance notifications are sent based on the selected action rule.

Figure 2 Selecting the direct alarm reporting mode
Alarm Noise Reduction: Alarms are sent only after being processed based on noise reduction rules, preventing alarm storms.
Select a grouping rule from the drop-down list. If existing grouping rules cannot meet your requirements, click Create Rule to create one. For details, see Creating a Grouping Rule.
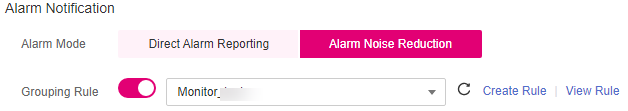
Figure 3 Selecting the alarm noise reduction mode
Click Create Now. As shown in the following figure, a threshold rule is created. Click
 to monitor the same metric of multiple resources.
In the expanded list, if the metric data of a host meets the preset alarm condition, a threshold alarm is generated on the alarm page. To view the alarm, go to the AOM console and choose Alarm Center > Alarm List in the navigation pane.
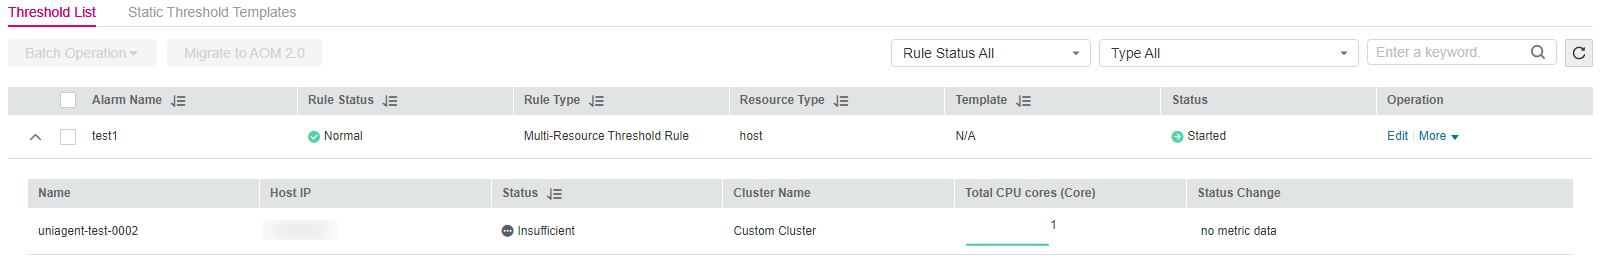
Figure 4 Creating a threshold rule
Using Templates to Create Threshold Rules
Before creating threshold rules, ensure that a static threshold template has been created according to Creating a Static Threshold Template.
Log in to the AOM console. In the navigation pane, choose Alarm Center > Alarm Rules. Then, click Create Alarm Rule in the upper right corner.
Set a threshold rule.
Set basic information such as the rule name and description.
Set details about the rule.
Set Rule Type to Threshold alarm.
Select monitored objects. When a template is used to create a threshold rule, you can select metrics only by dimension or resource. The command input mode is not supported.
Set an alarm condition. Click Template, select the created static threshold template from the drop-down list, and set parameters, such as Alarm Clearance and Action Taken for Insufficient Data.
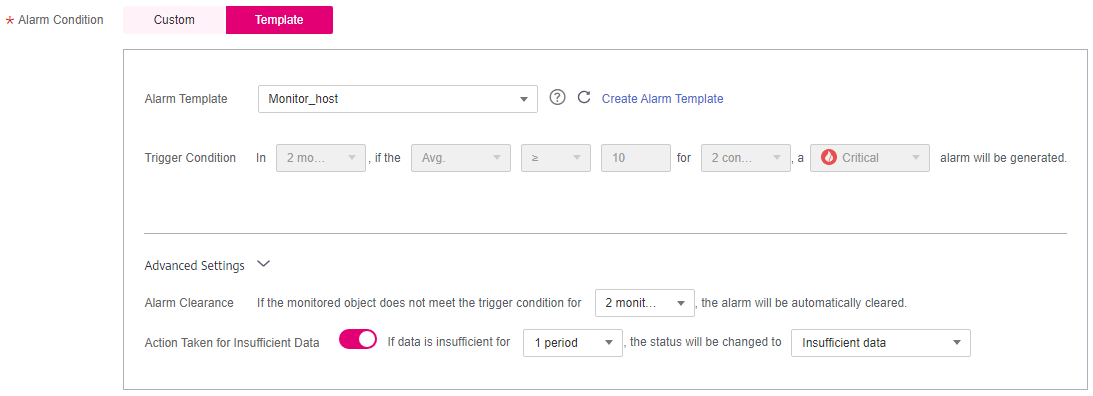
Figure 5 Setting an alarm condition
Table 2 Alarm condition parameters¶ Category
Parameter
Description
Alarm Template
-Select the static threshold template you have created. If the existing templates do not meet your requirements, click Create Alarm Template to create one. For details, see Creating a Static Threshold Template.
Trigger Condition
-The system automatically imports the preset trigger condition in the template. Note that the condition cannot be modified.
Advanced Settings
Alarm Clearance
An alarm will be cleared if the monitored object does not meet the trigger condition within the monitoring period. By default, metrics in only one period are monitored. You can set up to five monitoring periods.
Action Taken for Insufficient Data
Action to be taken when no metric data is generated or metric data is insufficient within the monitoring period. You can set this option based on your requirements.
By default, metrics in only one period are monitored. You can set up to five monitoring periods.
Options: Alarm, Insufficient data, Keep previous status, and Normal.
Set alarm tags and annotations to group alarms.
Click Add Tag or Add Annotation.
Set an alarm notification policy. There are two alarm notification modes.
Direct Alarm Reporting: An alarm is directly sent when the alarm condition is met.
Specify whether to enable an alarm action rule. After an alarm action rule is enabled, the system sends notifications based on the associated SMN topic and message template. If the existing alarm action rules cannot meet your requirements, click Create Rule to create one. For details, see Creating an Alarm Action Rule.
After an alarm action rule is selected, specify whether to enable alarm clearance notification. After alarm clearance notification is enabled, if the alarm clearance condition set in Advanced Settings > Alarm Clearance is met, alarm clearance notifications are sent based on the selected action rule.
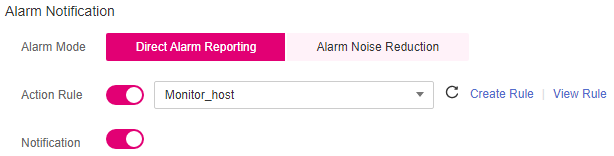
Figure 6 Selecting the direct alarm reporting mode
Alarm Noise Reduction: Alarms are sent only after being processed based on noise reduction rules, preventing alarm storms.
Select a grouping rule from the drop-down list. If existing grouping rules cannot meet your requirements, click Create Rule to create one. For details, see Creating a Grouping Rule.
Figure 7 Selecting the alarm noise reduction mode
Click Create Now. As shown in the following figure, a threshold rule is created. Click
to monitor the same metric of multiple resources.In the expanded list, if the metric data of a host meets the preset alarm condition, a threshold alarm is generated on the alarm page. To view the alarm, go to the AOM console and choose Alarm Center > Alarm List in the navigation pane.
Figure 8 Creating a threshold rule
More Operations
After creating a threshold rule, perform the operations listed in Table 3 if needed.
Operation | Description |
|---|---|
Editing a threshold rule | Click Edit in the Operation column. |
Deleting threshold rules |
|
Starting or stopping a threshold rule | Click Start or Stop in the Operation column. Note Single-resource threshold rules cannot be started or stopped. |
Searching for a threshold rule | You can search for a rule by rule name, description, or metric name. Simply enter a keyword in the search box in the upper right corner and click |
Viewing an alarm | When the metric value of a resource meets the threshold condition during the configured consecutive periods, the system reports a threshold alarm. In the navigation pane, choose Alarm Center > Alarm List to view the alarm. |
Viewing an event | When no metric data of a resource is reported during the configured consecutive periods, the system reports an insufficient data event. In the navigation pane, choose Alarm Center > Event List to view the event. |
 .
.