Viewing an Interception Report
Scenarios
This topic describes how to view the protection statistics, including the traffic cleaning frequency, cleaned traffic amount, weekly top 10 attacked public IP addresses, and total number of intercepted attacks of all public IP addresses of a user.
Prerequisites
You have obtained an account and its password to log in to the management console.
Procedure
Log in to the management console.
Click
 in the upper left corner and select the desired region or project.
Under Security, choose Anti-DDoS. The Security Console is displayed.
Select the Statistics tab and view the protection statistics of all public IP addresses of a user, as shown in Figure 1.
You can set Report Date to view the security report within a specified time range (one week long). You can query statistics of the last four weeks, including the number of cleaning times, cleaned traffic volume, top 10 attacked public IP addresses, and total number of intercepted attacks.
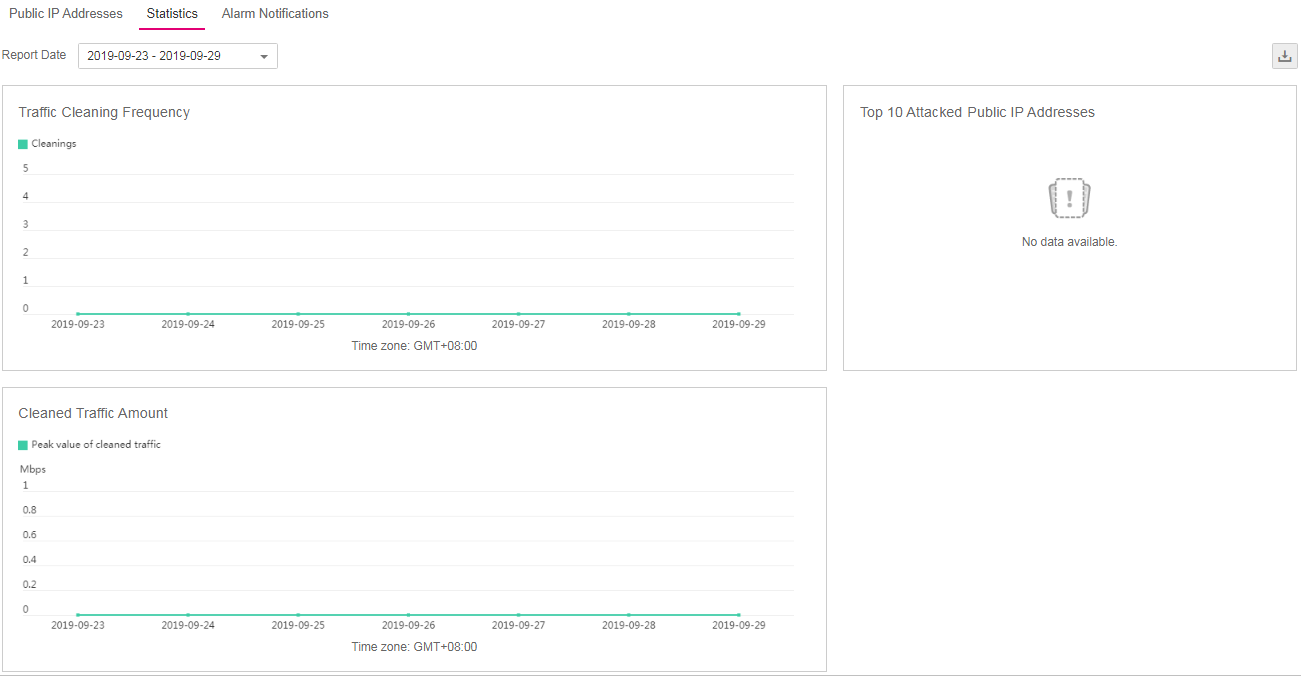
Figure 1 Interception report
Note
On the Statistics page, click
 to download monitoring reports to view protection statistics of a certain period of time.